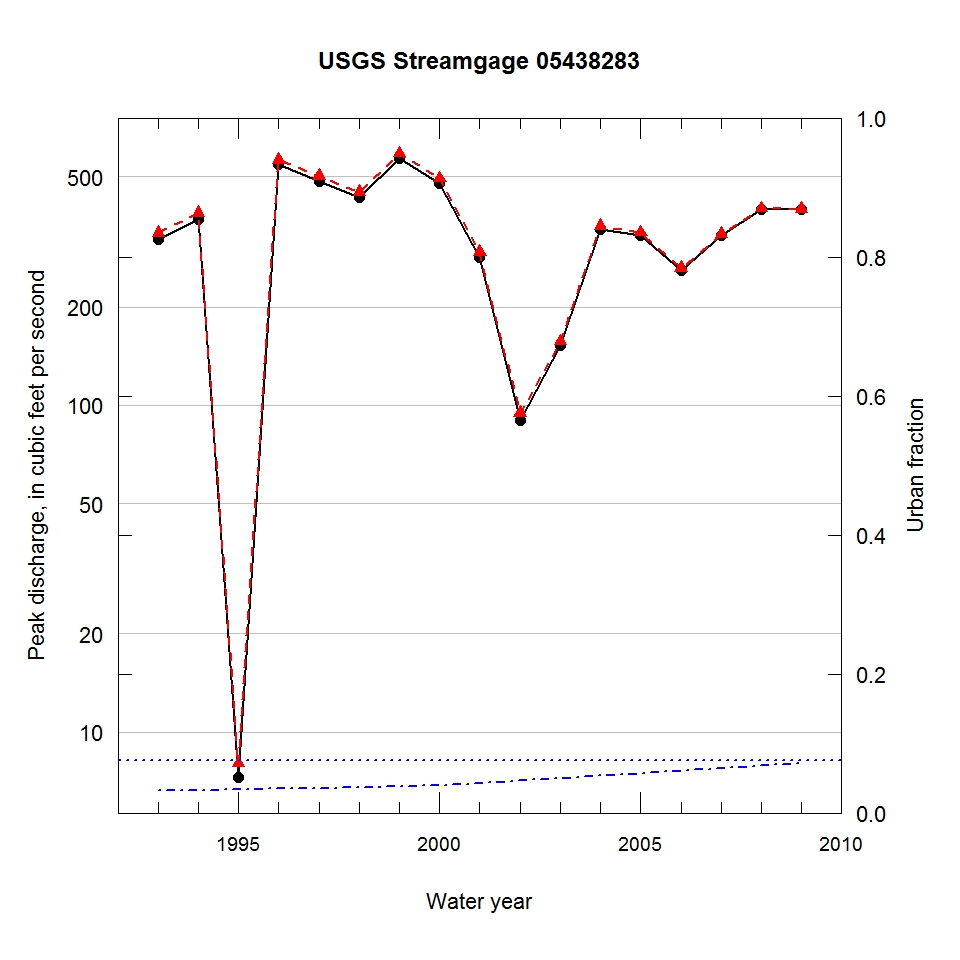
Observed and urbanization-adjusted annual maximum peak discharge and associated urban fraction and precipitation values at USGS streamgage:
05438283 PISCASAW CREEK NEAR WALWORTH, WI


| Water year | Segment | Discharge code | Cumulative reservoir storage (acre-feet) | Urban fraction | Precipitation (inches) | Observed peak discharge (ft3/s) | Adjusted peak discharge (ft3/s) | Exceedance probability |
| 1993 | 1 | -- | 0 | 0.032 | 1.283 | 322 | 337 | 0.387 |
| 1994 | 1 | -- | 0 | 0.033 | 0.733 | 371 | 387 | 0.299 |
| 1995 | 1 | -- | 0 | 0.034 | 0.994 | 7 | 8 | 1.000 |
| 1996 | 1 | -- | 0 | 0.035 | 0.894 | 544 | 564 | 0.111 |
| 1997 | 1 | -- | 0 | 0.036 | 1.805 | 484 | 502 | 0.159 |
| 1998 | 1 | -- | 0 | 0.037 | 0.817 | 433 | 449 | 0.207 |
| 1999 | 1 | -- | 0 | 0.038 | 1.209 | 571 | 590 | 0.095 |
| 2000 | 1 | -- | 0 | 0.039 | 0.977 | 478 | 494 | 0.165 |
| 2001 | 1 | -- | 0 | 0.043 | 0.840 | 283 | 294 | 0.485 |
| 2002 | 1 | -- | 0 | 0.046 | 1.482 | 90 | 95 | 0.935 |
| 2003 | 1 | -- | 0 | 0.050 | 0.913 | 152 | 157 | 0.826 |
| 2004 | 1 | -- | 0 | 0.054 | 1.109 | 345 | 353 | 0.358 |
| 2005 | 1 | -- | 0 | 0.057 | 0.485 | 332 | 338 | 0.385 |
| 2006 | 1 | -- | 0 | 0.061 | 1.021 | 259 | 263 | 0.568 |
| 2007 | 1 | -- | 0 | 0.065 | 1.361 | 330 | 334 | 0.394 |
| 2008 | 1 | -- | 0 | 0.068 | 0.894 | 397 | 400 | 0.279 |
| 2009 | 1 | -- | 0 | 0.072 | 0.338 | 397 | 398 | 0.281 |

